Loading...
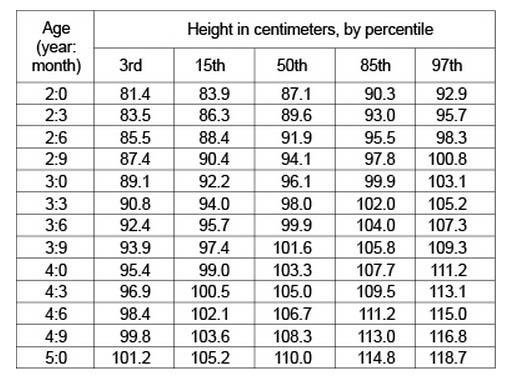
The World Health Organization (WHO) has produced a comprehensive set of growth standards for children. These standards are based on studies of children living in 6 nations on 5 continents under optimal conditions with respect to health and nutrition. The table displays the percentile distribution of height, in centimeters, at 3-month intervals, for boys ages 2 through 5 according to the WHO model. In a model population -- a large population of boys ages 2 through 5 that conforms to the WHO growth standards -- for \(\mathrm{n = 3, 15, 50, 85, and 97}\), \(\mathrm{n^{th}}\) percentile in height for a given age is the unique height among boys of that age that is greater than or equal to n percent, and less than or equal to \(\mathrm{(100-n)}\) percent, of heights of boys of that age.
For each of the following statements, select Yes if the statement must be true of a boy selected at random from a model population. Otherwise, select No.
If his age is greater than 3 years 3 months, the probability that his height is at least 98.0 cm is greater than 50%.
If he is at least 105 cm tall, the probability that his weight is 14.0 kg is no greater than 3%
If he is 114 cm tall, he is taller than at least 85% of boys his age.
| Information from Dataset | Analysis |
|---|---|
| "The World Health Organization (WHO) has produced a comprehensive set of growth standards for children. These standards are based on studies of children living in 6 nations on 5 continents under optimal conditions with respect to health and nutrition." |
|
| "The table displays the percentile distribution of height, in centimeters, at 3-month intervals, for boys ages 2 through 5 according to the WHO model." |
|
| "for \(\mathrm{n = 3, 15, 50, 85, and\,97}\), nth percentile in height for a given age is the unique height among boys of that age that is greater than or equal to n percent, and less than or equal to \(\mathrm{(100-n)}\) percent, of heights of boys of that age." |
|
| Table data showing heights from \(\mathrm{81.4\,cm}\) (2 years, 3rd percentile) to \(\mathrm{118.7\,cm}\) (5 years, 97th percentile) |
|
Summary: The WHO table shows ideal height ranges for boys ages 2-5, with percentile values tracking how height varies in a healthy population at 3-month intervals.
Summary: Source B complements Source A by showing appropriate weights for each height, allowing complete growth assessment - Source A tells if a boy is the right height for his age, while Source B tells if he's the right weight for his height.
This analysis examines three statements about boys' height and weight relationships using two sources: height-for-age standards showing percentile distributions for boys ages 2-5, and weight-for-height standards displaying weight distribution curves for heights from 80-120 cm. Each statement requires evaluation against specific percentile thresholds and age-related growth patterns.
The evaluation utilizes percentile data to determine probabilities and comparative standings. Source A provides age-specific height percentiles at 3-month intervals, while Source B shows weight percentiles for different height measurements. The analysis requires cross-referencing between age-height relationships and height-weight correlations to assess each statement's validity.
Source A - Height-for-age standards: Provides percentile distribution of heights for boys ages 2-5 at 3-month intervals. Key insight: Heights increase with age, and we can determine what percentage of boys at each age are above or below specific height thresholds.
Source B - Weight-for-height standards: Shows weight distribution curves for different height values from 80-120 cm. The graph displays \(\mathrm{3^{rd}}\), \(\mathrm{15^{th}}\), \(\mathrm{50^{th}}\), \(\mathrm{85^{th}}\), and \(\mathrm{97^{th}}\) percentile lines for weight at each height.
Each evaluation was verified against the appropriate data source with careful attention to percentile interpretations and age-specific growth patterns. The analysis confirms that statements 1 and 2 are supported by the percentile data, while statement 3 fails due to age-dependent height variations that create scenarios where the claim does not hold universally.
If his age is greater than 3 years 3 months, the probability that his height is at least 98.0 cm is greater than 50%.
If he is at least 105 cm tall, the probability that his weight is 14.0 kg is no greater than 3%
If he is 114 cm tall, he is taller than at least 85% of boys his age.