Loading...
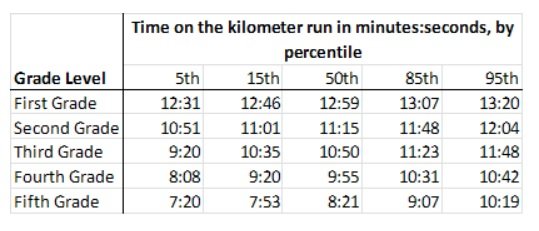
The Huffingdale All Boys School has produced a comprehensive set of running standards for young boys. These standards are based on data from young boys attending Huffingdale in good health conditions - as determined by a physician. The table displays the percentile distribution of time on a kilometer run for Huffingdale students at grade levels 1 through 5 according to the Huffingdale model. In a model population -- a large population of young students grade 1 through 5 that conforms to the Huffingdale running standards -- for \(\mathrm{n=5, 15, 50, 85, and 95}\), the nth percentile in running time for a given grade is the unique running time among boys of that grade level that is slower than or equal to n percent, and faster than or equal to \(\mathrm{(100 - n)}\) percent, of running times for students of that grade level.
Consider an individual boy from a model population. Suppose that from grades 1 through 5, this boy's height is at the 50th percentile for his running time and his running time is at the 50th percentile for his grade level. Which one of the following statements must be true of the boy at Grade 5?
His grade level is at the 50th percentile for his running time.
His height is at the 50th percentile for his grade level.
His running time is at the 50th percentile for his height.
His height is approximately 130% of his height in Grade 2.
His height is approximately 185% of his height in Grade 2.
| Information from Dataset | Analysis |
|---|---|
| "These standards are based on data from young boys attending Huffingdale in good health conditions - as determined by a physician" |
|
| "the nth percentile in running time for a given grade is the unique running time among boys of that grade level that is slower than or equal to n percent, and faster than or equal to (100 - n) percent" |
|
| First Grade times: 12:31 (5th percentile) to 13:20 (95th percentile) |
|
| Fifth Grade times: 7:20 (5th percentile) to 10:19 (95th percentile) |
|
Summary: This table presents kilometer run time standards showing that running speed improves substantially as students advance from grades 1-5, with older students running significantly faster times.
Chart Analysis:
Summary: This graph demonstrates that taller boys run faster times, which directly explains the grade-level improvements shown in Source A - older students are both taller and faster.
A boy maintains consistent relative performance: at each grade (1-5), he runs at exactly the middle speed for his grade, and his height is exactly average among boys who run at his speed. What must be true about him in Grade 5?
Key Constraints:
Answer Type Needed: Logical inference based on percentile relationships
Need to use Source A for grade-level running times at 50th percentile and Source B to find corresponding heights at those running times. The cross-source analysis shows how height and running performance are linked.
Can answer from analysis alone: Mostly YES - analysis provides the conceptual framework, but specific height values from Source B graph are needed for ratio calculations
From the analysis, we know: (1) Running times improve with grade level, (2) Taller boys run faster, (3) The boy's 50th percentile running times are: Grade 2 = 11 minutes (\(\mathrm{675\,sec}\)), Grade 5 = 8 minutes 21 seconds (\(\mathrm{501\,sec}\))
Hypothesis: Need to evaluate each statement against the percentile relationships
Statement: "His grade level is at the 50th percentile for his running time"
Statement: "His height is at the 50th percentile for his grade level"
Statement: "His running time is at the 50th percentile for his height"
Statement: "His height is approximately \(\mathrm{130\%}\) of his height in Grade 2"
Statement: "His height is approximately \(\mathrm{185\%}\) of his height in Grade 2"
Evaluating the height ratio statements requires accurately extracting values from Source B graph:
His height is approximately \(\mathrm{185\%}\) of his height in Grade 2.
His grade level is at the 50th percentile for his running time.
His height is at the 50th percentile for his grade level.
His running time is at the 50th percentile for his height.
His height is approximately 130% of his height in Grade 2.
His height is approximately 185% of his height in Grade 2.