OWNING THE DATASET
Understanding Source A: Graph - Annual Salt Use on Roads in Nation X (1940-2005)
Chart/Graph Analysis:
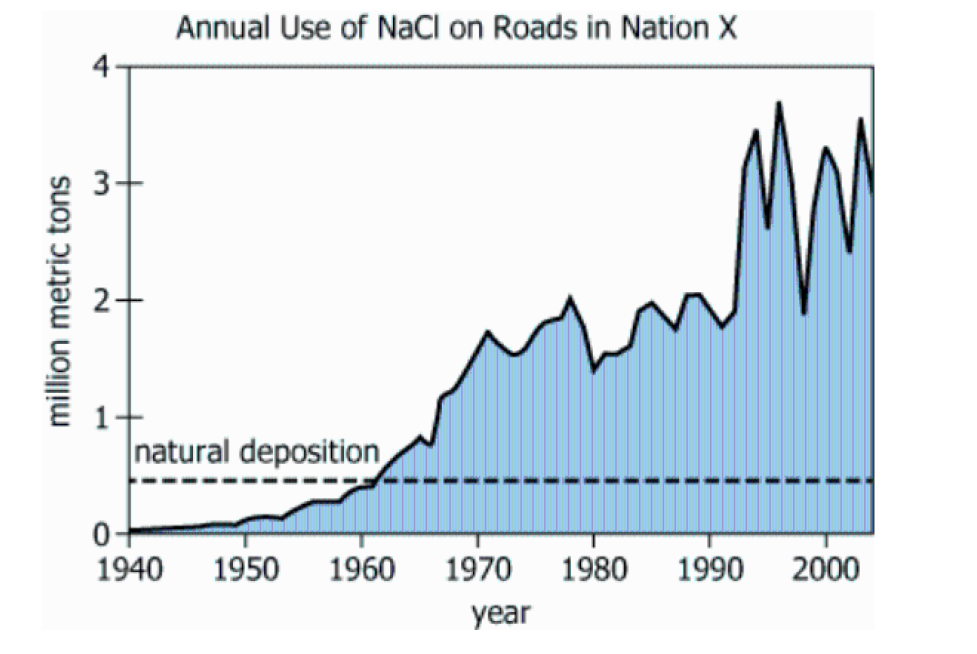
- The graph shows annual road salt (NaCl) use in Nation X from 1940 to 2005, measured in million metric tons
- A horizontal dashed line indicates "natural deposition" at approximately 0.5 million metric tons - this represents the amount of salt that would naturally occur through rainfall and other natural processes
- Key patterns observed: Salt use increased dramatically from near zero in 1940 to peaks around 3.5-3.6 million metric tons in the late 1990s/2000s, with some fluctuations but an overall strong upward trend
- Inference: Current salt use peaks at approximately 7 times higher than natural deposition levels
- Inference: This massive increase in salt has contaminated surface waters (rivers, streams, lakes) to toxic levels for plants and fish
- Inference: Humans are experiencing health effects from increased salt intake through contaminated water
- Inference: Sodium is filtered by soil better than chloride, so underground water has less sodium contamination than surface water
Summary: Nation X's road salt use has increased dramatically since 1940 to levels 7 times higher than natural deposition, causing toxic contamination of surface waters that harms plants, fish, and human health.
Understanding Source B: Graph - Monarch Butterfly Experiment Results
Chart/Graph Analysis:
- The graphs compare monarch butterflies that ate milkweed from prairies (no salt exposure) versus those that ate milkweed growing next to salt-treated roads
- Measurements include thoracic protein levels and relative eye width for both male and female butterflies
- Error bars show experimental uncertainty - when bars don't overlap, the difference is statistically significant
- Key patterns observed: For males, road-exposed butterflies had significantly higher thoracic protein (1.67 vs 1.45) but significantly lower relative eye width (1.44 vs 1.58)
- Key patterns observed: For females, neither measurement showed statistically significant differences between prairie and road groups
- Inference: Road salt affects male and female butterflies differently - only males show significant physiological changes
- Inference: Milkweed plants absorb sodium from salt-contaminated soil near roads, creating a pathway for salt to enter the butterfly food chain
- Linkage to Source A: This experiment demonstrates a specific example of how the surface water and soil contamination documented in Source A affects wildlife through the food chain (contaminated soil → milkweed → butterfly physiology)
Summary: Road salt contamination documented in Source A is shown to specifically affect monarch butterflies through sodium-enriched milkweed, with male butterflies experiencing significant physiological changes while females remain unaffected.
Understanding Source C: Text - Discussion Between Two Municipality Residents
| Information from Dataset |
Analysis |
| "Two residents of the Nation X municipality where the experiment described under the Butterflies tab was conducted are discussing the use of salt on roads." |
- Two local residents are discussing road salt in the same area where the butterfly study took place
- Linkage to Source B: The butterfly research appears directly relevant to this community discussion
|
| "Resident 1 asserts that this use has had an effect on animal life. The annual amount should therefore be reduced everywhere, such that the total amount used per year across the country never exceeds the average natural deposition across the country." |
- Resident 1 is concerned about ecological impacts on animals
- They propose capping national salt use at natural deposition levels (approximately 0.5 million metric tons based on Source A)
- Linkage to Source A: This would require an 85% reduction from current peak usage levels
- Linkage to Source A: The proposed cap matches the natural deposition baseline shown in Source A
- Linkage to Source B: Resident 1's animal concerns align with the documented butterfly impacts in their municipality
|
| "Resident 2 recommends a similar reduction, but only because of adverse health effects on people due to elevated levels of sodium in drinking water." |
- Resident 2 agrees on reducing salt but for different reasons
- Their concern is specifically about human health from sodium in drinking water
- Inference: The two residents agree on the solution (reduction to natural levels) but disagree on the primary motivation
- Linkage to Source A: However, Source A indicates sodium is filtered by soil and likely negligible in underground water - this creates a contradiction about sodium in drinking water
|
Summary: Two residents in the municipality where butterfly impacts were documented agree that road salt should be reduced to natural deposition levels, though one cites animal welfare concerns while the other focuses solely on human health impacts from contaminated drinking water.
Overall Summary
- Nation X's road salt use has increased to 7 times natural levels since 1940, causing documented harm to both wildlife and human health
- Scientific evidence shows salt contamination creates toxic conditions in surface waters and affects organisms through the food chain
- Male monarch butterflies demonstrate physiological changes when feeding on contaminated milkweed, showing direct food chain impacts
- Local residents in affected communities are calling for dramatic 85% reductions in salt use back to natural deposition levels
- Residents disagree on whether ecological or human health impacts should drive policy change, despite agreeing on the solution
- The scale of proposed reduction matches the scale of current overuse, essentially reversing 60+ years of increasing salt application
Question Analysis
For each of the three measurements listed, determine if the data shows a statistically significant difference between groups being compared.
- Must evaluate statistical significance
- Answer Yes if statistically significant, No if not
- Three separate evaluations needed
Answer type needed: Statistical significance verification
Connecting to Our Analysis
The analysis contains information about sodium in aquifers from Source A, and butterfly eye width measurements from Source B with statistical significance criteria. Analysis and data tables contain all needed information to answer from analysis alone.
Extracting Relevant Findings
Evaluating each statement against the provided data and statistical significance criteria. Statistical significance is determined by non-overlapping error intervals for butterfly data, and by explicit statements for aquifer data.
Individual Statement/Option Evaluations
Statement 1 Evaluation
Question: Is there a statistically significant difference in sodium amounts in aquifer drinking water?
- Criteria: Statistical significance requires measurable differences between comparable groups
- Evidence: Source A states sodium levels in aquifers are "likely negligible in most locations"
- Analysis: Since the levels are described as negligible, there would be no meaningful difference to measure
- Conclusion: No statistical significance can be established for differences in sodium amounts in aquifer-derived drinking water
Statement 2 Evaluation
Question: Is there a statistically significant difference in eye widths between prairie and road male butterflies?
- Criteria: Statistical significance when error intervals do not intersect
- Evidence: Prairie males: approximately 1.244mm, Road males: approximately 1.233mm
- Analysis: Error bars (vertical line segments) for male relative eye width show overlapping intervals between prairie and road males
- Conclusion: Overlapping intervals indicate no statistical significance
Statement 3 Evaluation
Question: Is there a statistically significant difference in eye widths between prairie and road female butterflies?
- Criteria: Statistical significance when error intervals do not intersect
- Evidence: Prairie females: approximately 1.155mm, Road females: approximately 1.193mm
- Analysis: Error bars for female relative eye width show experimental error intervals do not overlap
- Conclusion: Non-overlapping error intervals meet the criteria for statistical significance
Systematic Checking
Verifying conclusions against source criteria:
- Source B states differences are significant when error intervals don't intersect
- Male butterfly eye width error intervals overlap, indicating no statistical significance
- Female butterfly eye width error intervals do not overlap, indicating statistical significance
- Source A provides no comparison data for aquifer sodium, only states it's negligible
Final Answer
- Statement 1: No
- Statement 2: No
- Statement 3: Yes