Loading...
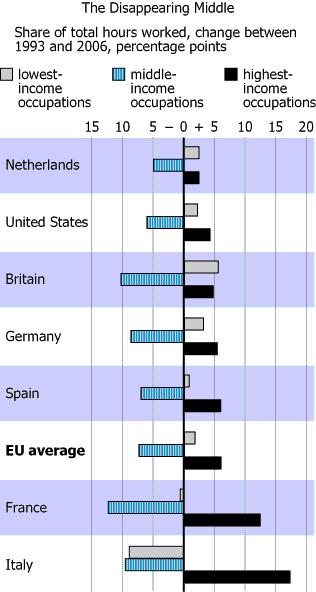
In the 1970s and 1980s, employment in middle-income occupations-payroll processing and accountancy, for example-grew faster across Europe and the United States than employment in lower-income jobs. But around the early 1990s something changed. With few exceptions, employment in middle-income occupations began to decline as a share of the total, while the share of both low- and high-income occupations rose. This pattern of polarization occurred in countries with very different welfare systems and levels of unionization and collective bargaining.
The support provided in the given information for the claim that a significant amount of employment polarization is due to IT would be most weakened by adding which of the following assumptions?
The degree of correlation between individual income and level of educational attainment varies significantly among the various countries wherein the studies described in the given information were conducted.
Commuting zones with the least amount of employment polarization tend to have the lowest levels of average educational attainment.
Commuting zones wherein business and industry spend the most on IT and research and development tend to have the least amount of employment polarization.
A significant number of commuting zones have more employment polarization than other commuting zones.
Commuting zones with the greatest amount of employment polarization tend to have the lowest average level of educational attainment.
| Information from Dataset | Analysis |
|---|---|
| "In the 1970s and 1980s, employment in middle-income occupations—payroll processing and accountancy, for example—grew faster across Europe and the United States than employment in lower-income jobs." |
|
| "But around the early 1990s something changed." |
|
| "With few exceptions, employment in middle-income occupations began to decline as a share of the total, while the share of both low- and high-income occupations rose." |
|
| "This pattern of polarization occurred in countries with very different welfare systems and levels of unionization and collective bargaining." |
|
Chart Analysis: "The Disappearing Middle"
Summary: Source A reveals that starting in the early 1990s, middle-income jobs declined as a share of employment while both low- and high-income jobs increased across many different countries, creating a "polarization" effect in the job market.
| Information from Dataset | Analysis |
|---|---|
| "In a study aimed at discerning the effects of information technology (IT) on numbers of middle-income jobs" |
|
| "researchers developed a method for classifying tasks as routine or nonroutine" |
|
| "Jobs were deemed more or less subject to automation on the basis of this classification. Jobs thus subject to automation included many jobs in middle-income occupations." |
|
| "the researchers divided the United States into regions, or commuting zones, deemed to correspond to labor markets" |
|
| "employment polarization...between 1980 and 2005 was most marked in regions where employment in jobs subject to automation initially predominated" |
|
Summary: Source B reveals that IT and automation displaced routine middle-income jobs, with regions having more automation-prone jobs experiencing greater polarization between 1980-2005, explaining the mechanism behind Source A's documented pattern.
| Information from Dataset | Analysis |
|---|---|
| "researchers analyzed industry-level data from eleven countries—nine European countries, Japan, and the US—for the years between 1980 and 2004" |
|
| "industries that adopted IT at faster rates (as measured by their IT spending as well as their spending on research and development)" |
|
| "saw faster growth in demand for highly educated workers and the sharpest declines in demand for people with intermediate levels of education" |
|
| "This suggested to the researchers a pronounced association between IT and employment polarization" |
|
Summary: Source C confirms across eleven countries that industries adopting IT faster experienced increased demand for highly educated workers and decreased demand for intermediate education levels, providing industry-level evidence that complements the geographic patterns in Source B and explains the global phenomenon documented in Source A.
The question asks which statement, if assumed true, would most weaken the argument that information technology (IT) causes employment polarization (i.e., the decline of middle-income jobs).
Key Constraints:
Answer Type Needed: Comparative analysis to identify the single assumption that most undermines the claim
The analysis shows that Sources B and C link IT adoption and spending to increased employment polarization, especially affecting routine and middle-education workers. To answer, I must find the assumption that most directly contradicts this link.
Can answer from analysis alone: YES - the analysis clearly establishes the IT-polarization relationship to judge which assumption undermines it
The key evidential findings show a positive relationship between IT usage/spending and employment polarization. Sources B and C show IT adoption/spending leads to displacement of middle-skilled jobs and increased polarization.
Hypothesis: Regions and industries with higher IT use have experienced greater polarization.
Statement: "The degree of correlation between individual income and level of educational attainment varies significantly among the various countries wherein the studies described in the given information were conducted."
Analysis: This addresses demographic variation, not IT's causal role. The IT-polarization link focuses on causal impact of technology, not correlation variability. This does not challenge IT's causal impact and therefore weakly addresses the IT-polarization claim.
Statement: "Commuting zones with the least amount of employment polarization tend to have the lowest levels of average educational attainment."
Analysis: This suggests low-education regions may avoid polarization, but this is actually consistent with IT theory as low-skill jobs are less automatable. This supports rather than contradicts IT's role and does not weaken the claim.
Statement: "Commuting zones wherein business and industry spend the most on IT and research and development tend to have the least amount of employment polarization."
Analysis: This directly contradicts the claim that more IT leads to more polarization. Given that established evidence indicates higher IT spending causes greater polarization, this assumption reverses the causal relationship and strongly weakens the IT-polarization claim.
Statement: "A significant number of commuting zones have more employment polarization than other commuting zones."
Analysis: This is purely descriptive, stating that polarization varies across zones. It does not address the causal relationship between IT and polarization, making it irrelevant to weakening the IT-polarization argument.
Statement: "Commuting zones with the greatest amount of employment polarization tend to have the lowest average level of educational attainment."
Analysis: This describes a relationship between education levels and polarization but does not conflict with IT causation. The IT-polarization theory can coexist with this educational pattern, so this does not weaken the claim.
Review of all options for completeness and direct contradiction:
Answer: "Commuting zones wherein business and industry spend the most on IT and research and development tend to have the least amount of employment polarization."
This statement most effectively weakens the argument by directly contradicting the established causal relationship between IT spending and employment polarization.
The degree of correlation between individual income and level of educational attainment varies significantly among the various countries wherein the studies described in the given information were conducted.
Commuting zones with the least amount of employment polarization tend to have the lowest levels of average educational attainment.
Commuting zones wherein business and industry spend the most on IT and research and development tend to have the least amount of employment polarization.
A significant number of commuting zones have more employment polarization than other commuting zones.
Commuting zones with the greatest amount of employment polarization tend to have the lowest average level of educational attainment.